
Arthur C. Clarke wrote that "any sufficiently advanced technology is indistinguishable from magic."
A truck drives across your field and hands back maps of phosphorus, potassium, pH and texture, at 335 points an acre. Growers ask us all the time if it's for real.
It is. There's no magic in it: it's physics plus your own lab results. And it changes how you should think about zones.

What's wrong with zones?
It took the industry almost two decades to get growers thinking in zones. Zones were a big step up from one rate per field.
Here's how zone sampling usually works. An EC or EM map, or a yield map, cuts a 300-acre field into 5 to 7 zones. Then each zone gets sampled as one polygon: cores from all over the zone go into one bag, and the lab sends back one number.
Two problems. Every acre inside a zone gets the same number, so the variability inside it disappears. And "Zone 1" is rarely one block. It can be 10 separate patches scattered across the field, all mixed into the same bag. If those patches are short on P for different reasons, you'll never know.

What do we do instead?
We map first and zone last.
- Scan. The SoilOptix rig reads the field at about 335 points per acre.
- Sample where the scan says. The software tells us exactly where to pull cores: about one per 8 acres, each its own lab test.
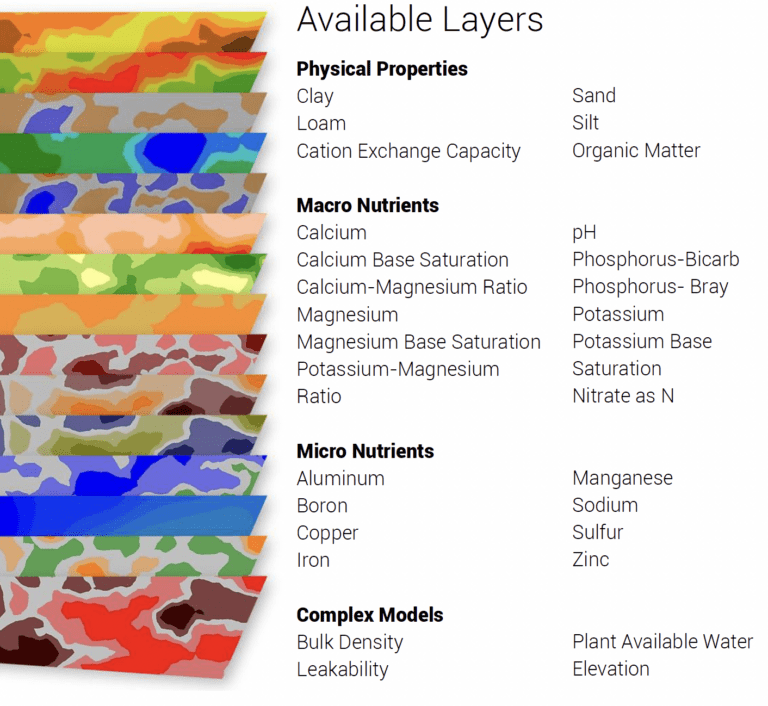
- Map. The lab results calibrate the scan, and every layer comes back as a raster of 3-meter (10-foot) pixels: P, K, pH, organic matter, CEC, texture and more.
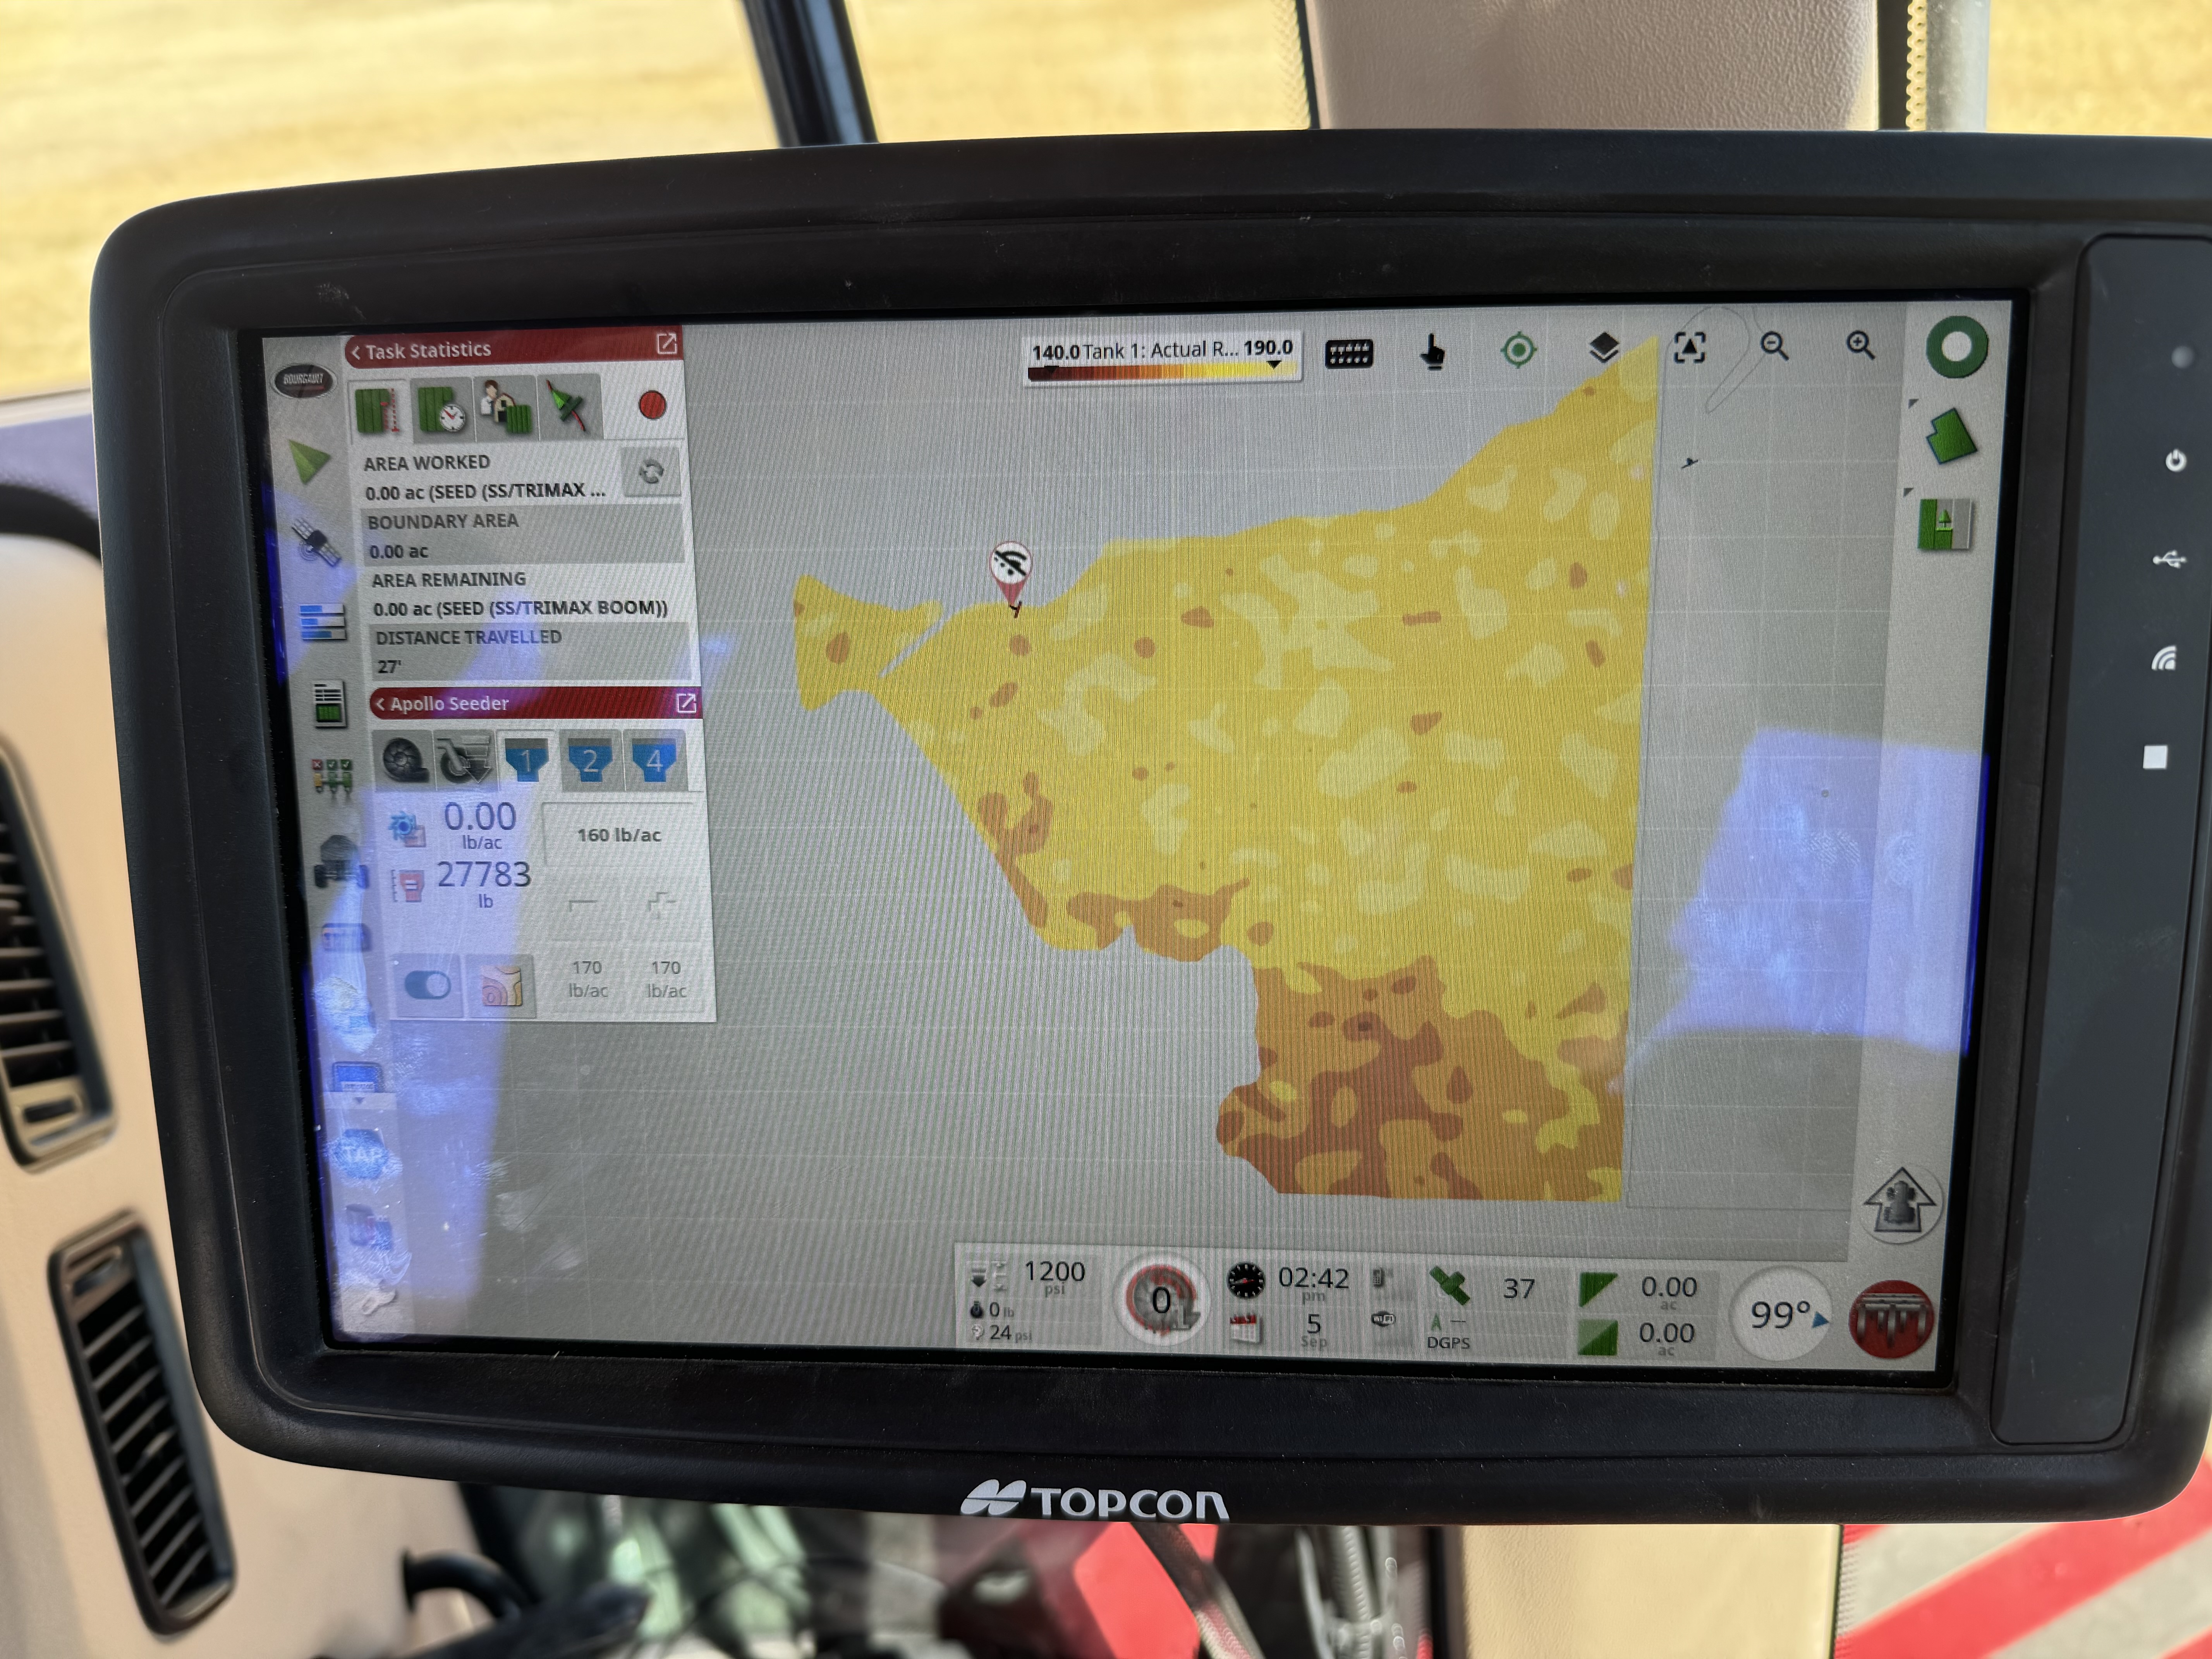
- Zone the prescription. Only now do zones come in. Your seeder doesn't want 100 rates, so we build 7 to 10 from the full map.
Similar sampling to a zone program, and far more definition. Seven zones give you 7 values for the whole field. A 3-meter raster gives you a value in every pixel: over 130,000 on a 300-acre field. The zones in your prescription are drawn from that map instead of guessed before anyone pulled a core.
What is the scanner reading?
Natural gamma radiation coming out of the soil: four separate signals, from potassium, thorium, uranium and cesium. Those elements live in the clay and minerals of your soil, so together they're a fingerprint of what the soil is.
Nearly all of it comes from the top foot, the root zone (IAEA).
How is that different from EC or EM mapping?
EC and EM read one thing: electrical conductivity. That one reading blends salt, clay, moisture, organic matter and temperature together (USDA review), so the same field can read differently wet than dry.
| EC / EM zone program | SoilOptix | |
|---|---|---|
| What it reads | One blended signal: conductivity | Four natural signals from the soil's minerals |
| How it's sampled | One bulk sample per zone | Cores where the scan says, each its own test |
| What you get back | One number per zone | 25+ layers in 3-meter pixels |
| When zones happen | First, before sampling | Last, in the prescription |
The data density is hard to believe the first time you see it. That's the point.
Does it match the lab?
Universities have put SoilOptix itself up against lab results. (An r of 1.0 would be a perfect match.)
- University of Alberta, 2024: on one field, scan and lab agreed at r = 0.83 to 0.95 for most soil properties (Enesi et al.).
- Washington State University, 2024: calcium matched the lab at r = 0.92 (Sallato).
In a 2015 Ontario study, one field was mapped three ways: a one-acre lab grid, EC zones and SoilOptix (the study).
| 1-acre lab grid | EC zones | SoilOptix | |
|---|---|---|---|
| pH | 7.4 | 7.6 | 7.4 |
| CEC | 12.6 | 11.7 | 12.2 |
| Calcium (ppm) | 1,742 | 1,752 | 1,815 |
| Organic matter (%) | 3.4 | 3.0 | 3.6 |
The scan matched the lab grid's pH exactly and came within 0.4 on CEC. The difference is everything between the averages: the scan maps the whole field, not one number per zone.
Grids have the same blind spot as zones. In Illinois, a 2.5-acre grid matched the field's real phosphorus pattern at only r = 0.16 to 0.47 (Franzen & Peck).
Where does it pay? Phosphorus and potassium.
That's where the money is. In Iowa State's strip trials, fields responded to P or K in more than two-thirds of field-years, and variable rate moved P to the ground that was short and off the ground that had plenty (Iowa State).
Our own W02 field called for 15 to 125 lbs of MAP across 10 prescription zones, an 8x range. One flat rate would have overfed part of that field and starved the rest.
Does a scan last?
Yes. We've scanned our own fields twice, two years apart, and the soil pattern came back the same.
One scan serves five crop seasons. When the nutrient numbers need updating, we pull fresh cores and re-run the prescription.
Frequently Asked Questions
Why do you still pull soil cores?
They tie the map to real lab numbers from your field, at the spots the scan picks. Each core is its own test, never bagged with the rest of a zone.
Don't I end up with zones anyway?
Yes, at the end. Your equipment wants 7 to 10 rates, so we build those from the full map. The difference is that they're drawn from the field's real detail.
Is this the same as EC mapping?
No. EC reads one blended conductivity signal and usually leads to zone sampling. The scan reads four natural signals and comes back as 25+ layers in 3-meter pixels.
Can you scan frozen ground?
Yes. Frozen ground is fine; only big snow drifts or ice stop a scan.
What does it cost?
$12.50 an acre for the scan and lab samples. FarmIQ Soil RX prescriptions are $0.50 an acre per nutrient, or $2.50 an acre for all maps. See the price list.
Want to see your field at 335 points an acre? Call or text (406) 271-6400, or email support@farmtech.us.